This is the supporting page for our paper Current Time Series Anomaly Detection Benchmarks are Flawed and are Creating the Illusion of Progress.
Keywords: Anomaly detection, benchmark datasets, deep learning, and time series analysis.
Update (Jan. 25, 2022): Extended abstract accepted by 38th IEEE International Conference on Data Engineering (ICDE2022), TKDE Poster Track.
Update (Sep. 9, 2021): Accepted by IEEE Transactions on Knowledge and Data Engineering (TKDE), doi:10.1109/TKDE.2021.3112126.
Update (Aug. 14, 2021): The Hexagon ML/UCR Time Series Anomaly Archive is now available: https:
@Article{Wu2021,
  author    = {Renjie Wu and Eamonn Keogh},
  journal   = {{IEEE} Transactions on Knowledge and Data Engineering},
  title     = {Current Time Series Anomaly Detection Benchmarks are Flawed and are Creating the Illusion of Progress},
  year      = {2023},
  number    = {3},
  pages     = {2421--2429},
  volume    = {35},
  doi       = {10.1109/TKDE.2021.3112126},
  publisher = {Institute of Electrical and Electronics Engineers ({IEEE})},
}
ACM SIGKDD 2021 Time Series Anomaly Detection Contest

For more details, go to the contest landing page.
We are delighted to announce that there will be a time series anomaly detection contest under the auspices of ACM SIGKDD 2021.
The contest will provide 200 time series datasets, divided into a train phase and a test phase. The task is to build your model on the train phase and predict the location of the single anomaly in the test phase.
We hope to encourage the development of general-purpose time series anomaly detection algorithms, thus the test datasets come from various domains: medicine, industry, human behavior, animal behavior, etc.
- First Prize: $2000 USD
- Second Prize: $1000 USD
- Third Prize: $500 USD
For the top 15 participants, we will provide a certificate with rank. All other participants will get a participation certificate.
Datasets
UCR Time Series Anomaly Archive
You can download the Hexagon ML/UCR Time Series Anomaly Archive from https:
Update (Jul. 12, 2021): We’re planning to release all data with labels and provenance during SIGKDD 2021.
Update (Mar. 15, 2021): The anomaly detection contest is now live. See Time Series Anomaly Detection Contest at SIGKDD 2021 for details.
Update (Jan. 7, 2021): Due to unforeseen situation, the contest is delayed (but not canceled). We will update this page once more information is available.
We will publicly release the UCR Time Series Anomaly Archive once our anomaly detection contest is over. The contest will be hosted by a third party and expected to be announced in the next 2 to 6 weeks on major sites, including Reddit (r/MachineLearning), KDnuggets and DBWorld.
E0509m Dataset
Below are the original and added noise E0509m dataset used to produce Fig. 13 and the pre-trained Telemanom1 model.
Original E0509m dataset contains 15,000 datapoints.
- Original
E0509mdataset: e0509m.csv. SHA1:549fe34ea23e143029172b4b15f8fbd5f793d511
The added noise E0509m dataset also contains 15,000 datapoints. We use
e0509m_rand_50 = e0509m + randn(size(e0509m)) * 50;
to generate the added noise version. You can also get it from
- Pre-generated added noise
E0509mdataset: e0509m_rand_50.csv. SHA1:438901ad44d2ab9916d45b0d2502f83554723376
The pre-trained Telemanom model is trained with default parameters in its paper1:
- Pre-trained Telemanom model: e0509m.h5. SHA1:
2d559897f948a0dab9c6eca245b8339b32048378
The training and testing datasets in npy format for Telemanom:
- Training dataset: training_e0509m.npy. SHA1:
88e2559b1b15253c30666e8f080db8c22a34c624 - Testing datasets
- Original
e0509mdataset: testing_e0509m.npy. SHA1:9209c644ea7d486307ea5fef2e69a245bd6fd479 - Added noise
e0509mdataset: testing_e0509m_rand_50.npy. SHA1:55c60fe24b04b1a09b95c33f6f9a1c409c6f8ede
- Original
Slides
Gallery of Problems with Benchmark Datasets
Below presentation contains dozens of additional examples from Yahoo2, Numenta3, NASA1 and Pei’s Lab (OMNI)4 that yield to one line solutions.
We also show some examples for some other datasets that are occasionally used for the anomaly detection.
In some cases we give some text or comments, in others we just do a screen dump of a MATLAB figure.
- Presentation: Gallery_of_Benchmark_Problems.pptx. SHA1:
a82f17ce679161690dc8cbb6362ae9ef7b95e496
Original Figures in the Paper
Below presentation contains all original figures in our paper.
In some cases we give some text or comments on how they are plotted, in others we just do a screen dump of a MATLAB figure.
- Presentation: anomaly_detection_benchmark_figures.pptx. SHA1:
40ae021206099c842a285b316302b5f534d78a5a
MATLAB Scripts
All MATLAB scripts are written with MATLAB R2018b.
- Brute-force one-liners on Yahoo Benchmark: bruteforceYahooBatch.m. SHA1:
b79742d4997dbdf5bd8750c9351f1d1aa3ee803a - Collect the rightmost anomaly’s location in Yahoo A1 Benchmark: scanYahooA1.m. SHA1:
54dd44f6e184cb821ddf9e18b6ef7facdcac4dc3 - Matrix Profile to compute Discord5 scores: mpx.m. SHA1:
61e339e9c0338396b5bc30e2ea1a276a59cfb9b0
Reproduce Results in the Paper
All original figures in the paper can be found in the slides in section Slides: Original Figures in the Paper.
Section 2.2: Triviality
Table. 1
| Dataset | Solvable with | # Time Series Solved | # Time Series in Dataset | Percent |
|---|---|---|---|---|
| A1 | (3) | 30 | 67 | 44.8% |
| (4) | 14 | 20.9% | ||
| Subtotal | 44 | 67 | 65.7% | |
| A2 | (3) | 40 | 100 | 40.0% |
| (4) | 57 | 57.0% | ||
| Subtotal | 97 | 100 | 97.0% | |
| A3 | (5) | 84 | 100 | 84.0% |
| (6) | 14 | 14.0% | ||
| Subtotal | 98 | 100 | 98.0% | |
| A4 | (5) | 39 | 100 | 39.0% |
| (6) | 38 | 38.0% | ||
| Subtotal | 77 | 100 | 77.0% | |
| Total | 316 | 367 | 86.1% |
The numbers in Table. 1 results from our brute-force algorithm:
bruteforceYahooBatch(1, '/path/to/yahoo-a1-benchmark/', 'A1Benchmark.csv');
bruteforceYahooBatch(1, '/path/to/yahoo-a2-benchmark/', 'A2Benchmark.csv');
bruteforceYahooBatch(0, '/path/to/yahoo-a3-benchmark/', 'A3Benchmark.csv');
bruteforceYahooBatch(0, '/path/to/yahoo-a4-benchmark/', 'A4Benchmark.csv');
Detailed explanations on our brute-force algorithm and its results (individual u, k, c and bs) can be found in the slides in section Slides: Gallery of Problems with Benchmark Datasets.
The bruteforceYahooBatch.m can be found in section MATLAB Scripts; Yahoo Benchmark2 datasets can be downloaded from here; The output files A1Benchmark.csv, A2Benchmark.csv, A3Benchmark.csv and A4Benchmark.csv will be stored in the current working directory.
Section 2.5: Run-to-failure Bias
Fig. 10
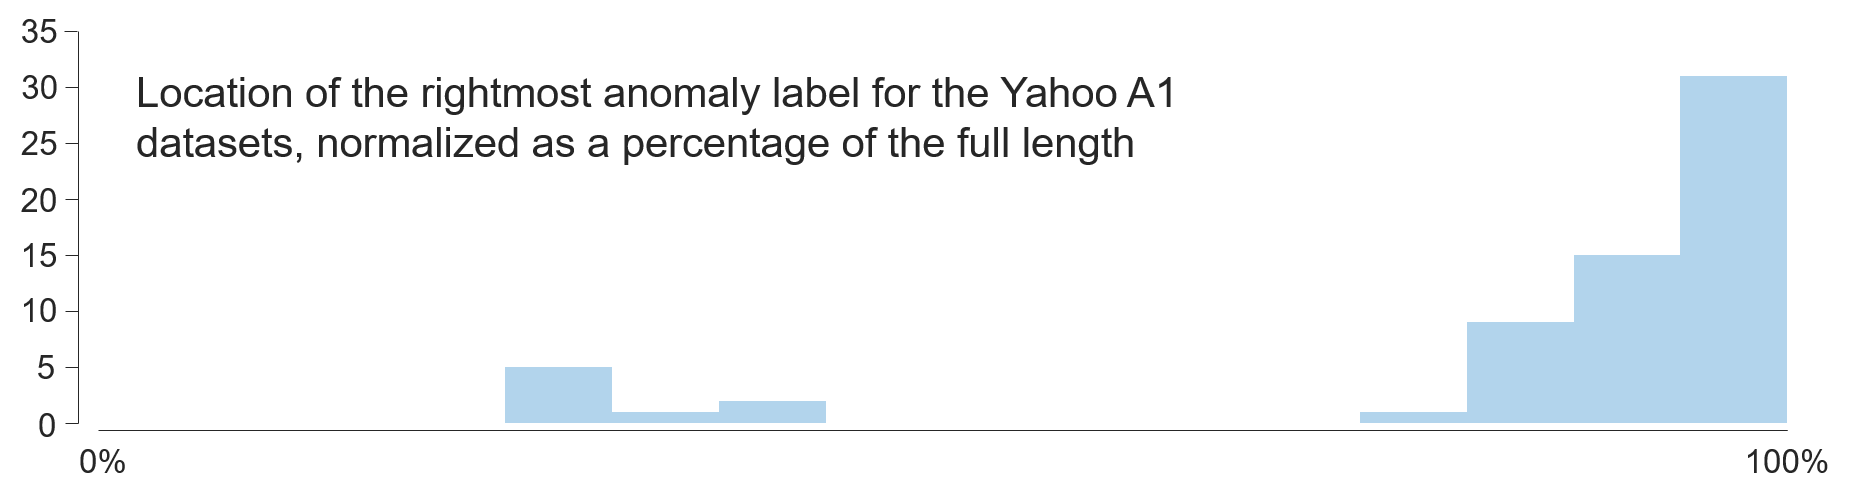
To produce Fig. 10, we run
locations = scanYahooA1('/path/to/yahoo-a1-benchmark/', 1);
to collect the rightmost anomaly’s location in Yahoo A1 Benchmark.
The returned variable locations will store the start index of all anomalies. If no anomalies are found, the corresponding index will be -1.
The scanYahooA1.m can be found in section MATLAB Scripts; Yahoo A1 Benchmark2 datasets can be downloaded from here.
Section 4.2: Algorithms should be Explained with Reference to their Invariances
Fig. 13
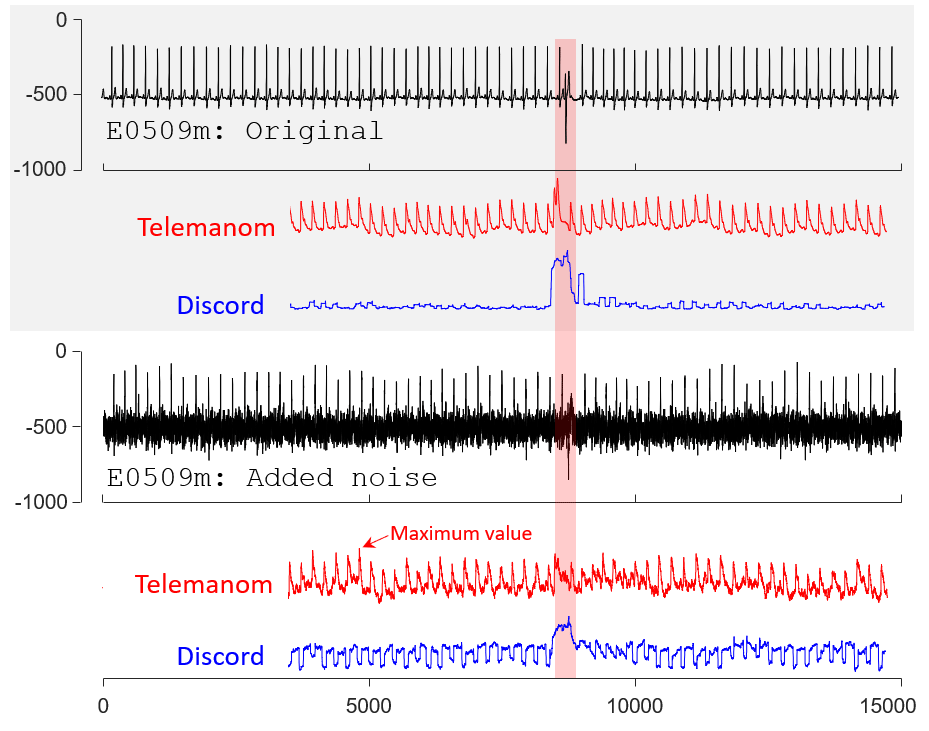
To produce Fig. 13, we first use
discord_original = mpx(e0509m, 100, 300);
discord_rand_50 = mpx(e0509m_rand_50, 100, 300);
to compute Discord5 scores.
The mpx.m can be found in section MATLAB Scripts; Both original and added noise E0509m dataset can be found in section Datasets: E0509m dataset.
For Telemanom1, we use the default parameters in their paper for training. The training datasets are the first 3,000 datapoints (normalized to [0, 1]) in original E0509m dataset.
The remaining 12,000 datapoints (normalized to [0, 1]) in original and added noise E0509m dataset are used for computing anomaly scores in Fig. 13.
Both the training and testing datasets can be found in section Datasets: E0509m dataset.
References
-
K. Hundman et al., “Detecting Spacecraft Anomalies Using LSTMs and Nonparametric Dynamic Thresholding,” Proc. 24th ACM SIGKDD Intl. Conf. Knowledge Discovery & Data Mining (KDD 18), 2018, pp. 387-395. ↩ ↩2 ↩3 ↩4
-
N. Laptev, S. Amizadeh and Y. Billawala, “S5 - A Labeled Anom-aly Detection Dataset, version 1.0 (16M),” Mar. 2015. ↩ ↩2 ↩3
-
S. Ahmad et al., “Unsupervised Real-Time Anomaly Detection for Streaming Data,” Neurocomputing, vol. 262, 2017, pp. 134-147. ↩
-
Y. Su et al., “Robust Anomaly Detection for Multivariate Time Series through Stochastic Recurrent Neural Network,” Proc. 25th ACM SIGKDD Intl. Conf. Knowledge Discovery & Data Mining (KDD 19), 2019, pp. 2828-2837. ↩
-
T. Nakamura et al, “MERLIN: Parameter-Free Discovery of Arbitrary Length Anomalies in Massive Time Series Archives,” Proc. 20th IEEE Intl. Conf. Data Mining (ICDM 20), to be published, 2020. ↩ ↩2